I often hear that DirectLake “removes the ability to define tables” and “doesn’t work like traditional Power BI or Tableau.” At a glance, the workflow is different—deliberately so—because Fabric is a data platform, not a visualization tool. In the old days we’d push transformations past gold and into the semantic layer because that was the only practical place left. That was necessary; it was never ideal. By definition, gold is supposed to be ready to consume.
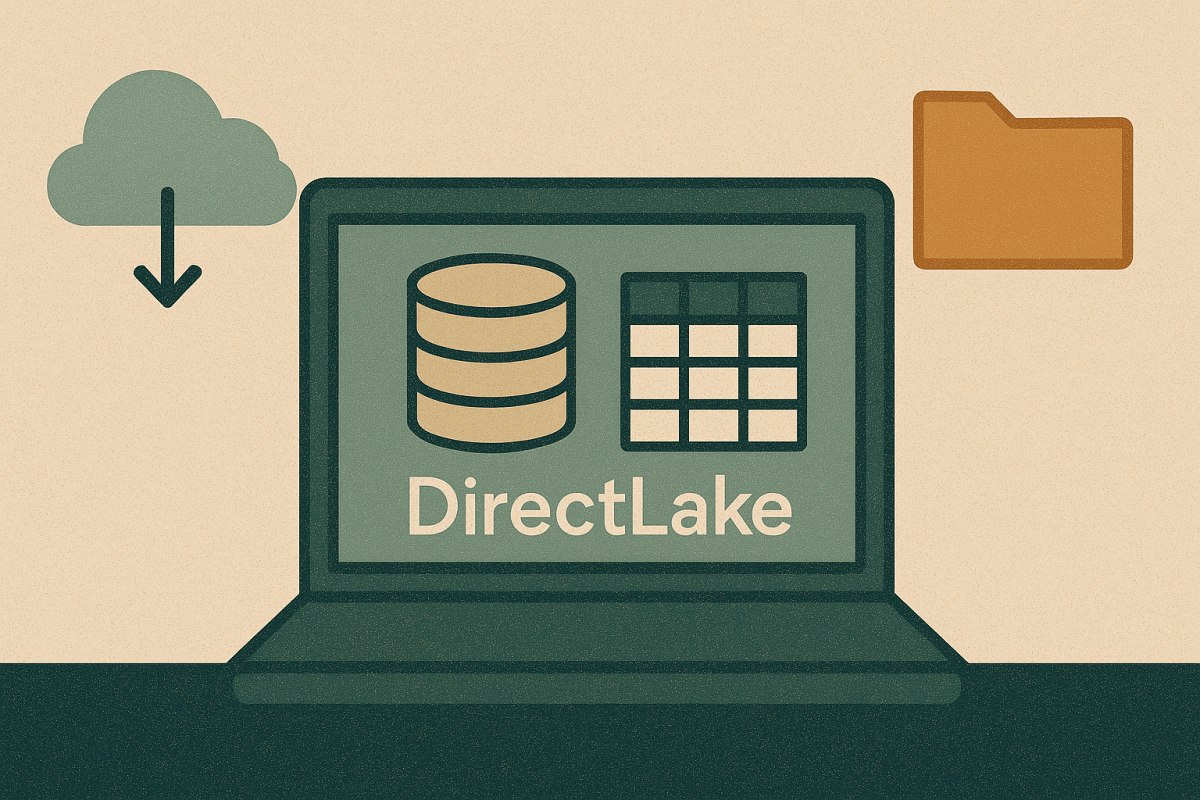
DirectLake mode in MS Fabric’s Power BI gives you (almost) everything Power BI gave you in Desktop. The one big thing you don’t do anymore is DAX calculated columns/tables—and that’s a feature, not a bug. Nuance for accuracy: In DirectLake, calculated columns and calculated tables that reference DirectLake tables aren’t supported; however, some calculated tables that don’t reference DirectLake tables (e.g., documentation helpers) and calculation groups/what‑if parameters are allowed. DirectLake reads Delta in OneLake, the model still uses VertiPaq, and data prep moves into the platform (Dataflows Gen2, Lakehouse/Warehouse SQL, notebooks).
The architecture stance: thin semantic, thick gold
With DirectLake, your semantic model points directly at Delta tables in OneLake—no import copy—and queries run through VertiPaq for interactive performance. Treat the semantic layer as thin: define relationships and measures only. Put computed columns, calculated tables, and pre‑aggregations into the platform and materialize them in gold.
Why this works better
- One definition of truth across Power BI, Tableau, notebooks, and APIs.
- Predictable performance—heavy work is done once upstream.
- Governance & lineage—transform steps are versioned, testable, observable.
- Less DAX contortion—the fragile bits (columns/tables) move out of the model.
Think of it as a thin semantic layer over a thick gold layer.
Shift‑left / shift‑right: put work where it pays
Shift row‑level calculations as far left as possible
Per‑record enrichments—flags, buckets, standardization, surrogate keys, SCD attributes, currency normalization, date parts—belong at or near the source.
Why left?
Quality, consistency, and cost. Correct once; use everywhere. It’s easier to test/monitor upstream, and you can handle streaming/CDC and privacy (masking/hashing) before data proliferates.
Where exactly?
Prefer the source system if you own it; otherwise apply during ingestion/silver/gold using Dataflows Gen2 (Power Query Online) or Warehouse/Lakehouse SQL. Dataflows Gen2 brings the familiar Power Query experience and hundreds of transforms to Fabric’s Data Factory, so most of what you did in Desktop’s Power Query you now do upstream.
Shift aggregations as far right as sensible
Rollups, time intelligence, and context‑sensitive math are often best as measures in the semantic model, where they can respond to filters and relationships. Pre‑aggregate in gold only when there’s clear value (reuse across many reports/tools, massive facts where on‑the‑fly group‑by is slow, strict latency SLAs, stable grains like daily → monthly).
Quick decision rule
| Question | If Yes | If No |
|---|---|---|
| Reused by many reports/tools? | Pre‑aggregate in gold | Keep as a measure |
| On‑the‑fly group‑by too slow? | Pre‑aggregate in gold | Measure |
| Depends on complex filter context? | Measure | Consider pre‑agg if grain is stable |
| Grain is stable and well‑defined? | Pre‑aggregate in gold | Measure |
What goes where (placement map)
| Requirement | Old habit (Desktop) | Fabric pattern (platform‑first) |
|---|---|---|
| Row‑level enrichments (flags, buckets, date parts) | DAX calculated columns | Dataflows Gen2 or SQL → materialize in gold |
| Calculated tables (scaffolds, conformed dims) | DAX calculated tables | Physical tables in gold via Dataflows Gen2 / SQL |
| High‑reuse rollups (e.g., monthly sales by customer) | Visual/group‑by at query time | Pre‑agg tables in gold, consumed with measures |
| Interactive business metrics | Mixed DAX columns + measures | Measures only over clean gold |
| Model structure | Ad‑hoc joins | Star schema in gold + relationships in the model |
DirectLake limitations: Calculated columns and calculated tables that reference DirectLake tables are not supported; some derived tables that don’t reference them and calc groups are allowed. Plan accordingly. (Microsoft Learn)
Migration playbook (practical and fast)
- Inventory DAX columns/tables and note their purpose.
- Classify each: row‑level enrichment vs aggregation.
- Shift‑left enrichments into Dataflows Gen2 or SQL; materialize in gold.
- Shift‑right aggregations into measures; pre‑aggregate only when the decision rule says so.
- Harden gold into a star schema with conformed dimensions and stable keys.
- Rebuild the semantic model thin: import tables, define relationships, recreate measures.
- Parity tests for key visuals/metrics.
- Document & retire the DAX columns/tables.
Common translations (DAX → platform)
1) Date dimension done right (from DAX table to platform—and why it’s better)
Before (DAX):
Calendar =
ADDCOLUMNS (
  CALENDAR (DATE(2018,1,1), DATE(2030,12,31)),
  "Year", YEAR([Date]),
  "Month", FORMAT([Date], "YYYY-MM"),
  "Quarter", "Q" & FORMAT([Date], "Q")
)
After (Power Query M in Dataflows Gen2):
let
  Start = #date(2018, 1, 1),
  End = #date(2030, 12, 31),
  Dates = List.Dates(Start, Duration.Days(End - Start) + 1, #duration(1,0,0,0)),
  Table = Table.FromList(Dates, Splitter.SplitByNothing(), {"Date"}),
  Enriched =
    Table.TransformColumns(
      Table.AddColumn(
        Table.AddColumn(
          Table.AddColumn(Table, "Year", each Date.Year([Date]), Int64.Type),
          "Month", each Date.ToText([Date], "yyyy-MM")
        ),
        "Quarter", each "Q" & Number.ToText(Date.QuarterOfYear([Date]))
      ),
      {"Month", Text.Type, "Quarter", Text.Type}
    )
in
  Enriched
Materialize to gold as dim_date.
Why this unlocks a far richer calendar:
Moving the calendar upstream lets you create a business‑grade date dimension with fiscal variants (4‑4‑5, 4‑5‑4), ISO weeks, “week‑in‑month,” “last business day,” seasonality buckets, trading calendars, and more—once—and reuse it across every tool. Microsoft’s modeling guidance treats a robust date dimension as a core element of a proper star schema.
Great starting script:
This MSSQLTips article provides an extensible T‑SQL pattern for an extended date dimension (fields like IsWeekend, IsHoliday, multiple name variants, YYYYMMDD keys). It runs on SQL Server and adapts easily to Fabric Warehouse (T‑SQL); translate to Lakehouse SQL or Dataflows Gen2 as needed.
Localization & holidays:
For global deployments, add localized fields—e.g., IsHolidayUS, IsHolidayGB, IsHolidayCA—or join dim_date to a holiday reference keyed by Date + RegionCode, then derive IsHoliday/HolidayName in gold. This enables country‑specific business day logic (SLA calculations, “last trading day,” regulatory deadlines) in measures without per‑report hacks. The MSSQLTips pattern’s IsHoliday column is the hook—extend it with your own regional calendars.
2) Bucketing / banding (from DAX column to SQL)
Before (DAX):
CustomerSize =
IF ( [Employees] < 50, "Small",
     IF ( [Employees] < 250, "Mid", "Enterprise" ))
After (SQL in Warehouse/Lakehouse):
CREATE OR REPLACE TABLE dim_customer AS
SELECT
  c.*,
  CASE
    WHEN employees < 50 THEN 'Small'
    WHEN employees < 250 THEN 'Mid'
    ELSE 'Enterprise'
  END AS customer_size
FROM stg_customer c;
3) Monthly aggregate (pre‑agg when justified)
Before: group‑by in visuals or DAX on the fly.
After (SQL):
CREATE OR REPLACE TABLE agg_sales_month AS
SELECT
  customer_id,
  date_trunc('month', order_date) AS month_start,
  SUM(net_amount) AS sales_amount,
  COUNT(DISTINCT order_id) AS orders
FROM fact_sales_day
GROUP BY customer_id, date_trunc('month', order_date);
Consume with a measure so filters/relationships still apply.
Measures still do the semantic heavy lifting
Time intelligence, context‑aware denominators, and business definitions belong in measures:
Sales YoY :=
VAR ThisYear =
  CALCULATE( [Sales Amount], ALL('dim_date'[Year]) )
VAR PriorYear =
  CALCULATE(
    [Sales Amount],
    DATEADD('dim_date'[Date], -1, YEAR),
    ALL('dim_date'[Year])
  )
RETURN DIVIDE( ThisYear - PriorYear, PriorYear )
Operability & performance tips (DirectLake‑aware)
- Optimize Delta in gold (V‑Order, fewer/larger parquet files, efficient row groups) to minimize paging and avoid fallback.
- Name with intent:
dim_,fact_,agg_; document grains, keys, and relationships. - Test upstream for row‑level logic; validate measures at the metric layer.
- Avoid unnecessary views on SQL endpoints if they trigger fallback to DirectQuery; materialize instead.
FAQ I get from teams
“So I can’t define calculated columns anymore?”
Correct for DirectLake‑based tables—do it upstream and persist in gold. (Some calculated tables that don’t reference DirectLake tables are still allowed; calc groups/what‑if are fine.) (Microsoft Learn)
“Where did my Power Query transforms go?”
Into Dataflows Gen2 (plus SQL/notebooks where appropriate), giving you the Power Query experience in Fabric’s Data Factory. (Microsoft Learn)
“Why the emphasis on star schema?”
Because it consistently yields simpler DAX, better performance, and cleaner models—especially in DirectLake. (Microsoft Learn)
Conclusion
DirectLake doesn’t remove modeling power; it repositions it where it scales:
- Shift row‑level calculations left—ideally into the source, otherwise into ingestion/silver/gold—so every tool consumes the same clean attributes.
- Shift aggregations right—implement as measures unless there’s a clear case for pre‑aggregating in gold.
- Keep the semantic layer thin—relationships + measures over well‑modeled gold—and treat a rich, localized date dimension as a first‑class platform asset, not a last‑mile hack.
If your current model relies on DAX columns/tables, you have your to‑do list: move them upstream, enrich your dim_date (holidays and all), keep your measures, and let DirectLake do what it was built to do—serve analytics from a real data platform.
