Most executives know Lean, Six Sigma, and Agile. Improvement science is the disciplined backbone behind those methods—a way to get measurable gains by learning quickly in the real world, not just in the boardroom. It’s been refined for decades in healthcare and education, but its core ideas translate cleanly to sales, operations, CX, finance, HR, and product. Here’s what it is—and how to start using it immediately.
What exactly is “improvement science?”
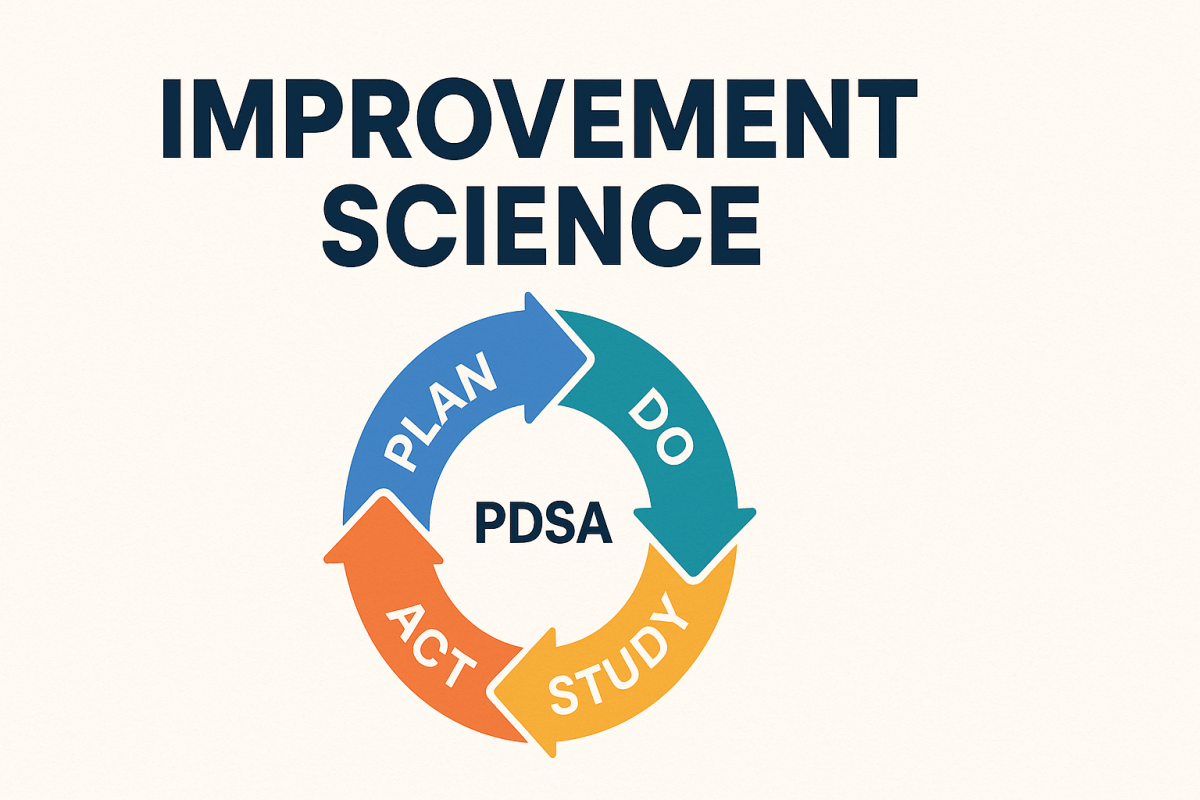
At its heart, improvement science is a structured way to answer three leadership questions: What are we trying to accomplish? How will we know a change is an improvement? What change can we make that will result in improvement? Teams use those questions with rapid Plan–Do–Study–Act (PDSA) cycles to test and adapt ideas in real work, using data over time to see whether things actually got better. If you’ve used A/B tests, sprints, or Kaizen events, you’re already close: improvement science adds a common language, a measurement discipline, and a cadence for turning small tests into scalable, sustained results.
Five principles that make it work
1) Start with a sharp aim. Define who and what will change, by how much, and by when. A precise aim creates line‑of‑sight from board priorities to front‑line action and makes trade‑offs explicit.
2) Measure for learning (not just reporting). Track a small, balanced set of measures tied to your aim: an outcome you care about (e.g., onboarding lead time), a few process indicators you will change to get there (e.g., percent of forms pre‑filled), and a balancing measure to protect what must not get worse (e.g., error rate). Fewer, better measures move debates from opinions to patterns.
3) See performance as a system. Every result is produced by a system. Map that system and change it. A driver diagram—a one‑page picture linking your aim to primary drivers (big levers), secondary drivers (component levers), and concrete change ideas—becomes your shared theory of how results will improve.
4) Run quick PDSA cycles in the real world. Start tiny: one rep, one branch, one day. Plan the change and the data you’ll collect, do the test, study what the data and people say, then act—adopt, adapt, or abandon. Repeat. You build knowledge fast, with minimal risk, in your actual context.
5) Honor variation. Not every up or down is meaningful. Learn to distinguish common‑cause noise from special‑cause signals so you don’t overreact to random bumps—or miss a real breakthrough. Simple run‑chart rules are often enough.
How it complements what you already use
- Lean focuses on removing waste – Improvement science supplies the small‑tests, measurement‑for‑learning engine that proves what actually works in your setting.
- Six Sigma brings deep statistical rigor – Improvement science starts lighter—run charts and practical measures—and escalates to control charts only when needed.
- Agile sprints deliver increments – PDSA cycles deliver improved operational outcomes. Use both: build better things and run the business better.
In education, these ideas scaled through Networked Improvement Communities—cross‑site teams iterating together and sharing what works and why. The same model can knit regions, stores, or product lines into a knowledge‑creating network.
A concrete example
Imagine your aim is to reduce new‑customer onboarding time from 21 days to 14 days for SMB accounts by December 31. Your driver diagram might point to three big levers: digital paperwork, work‑in‑process visibility, and handoff quality. Under those, you hypothesize that pre‑filling CRM data into forms and moving to e‑signature will attack digital delays; a daily 15‑minute huddle and a simple Kanban board will improve flow; and a Sales→Ops checklist plus a “Day‑0 kickoff” template will reduce rework at handoff.
You choose a tight measurement set: the outcome is median days from contract to go‑live; process measures include percent of forms pre‑filled, percent e‑signed, and percent of handoffs using the checklist; a balancing measure tracks onboarding defects or early‑life CSAT.
Now you run weekly PDSAs.
- Week one, pre‑fill the top five fields for one salesperson and note rework.
- Week two, pilot e‑signature with five SMB accounts and compare cycle time to baseline.
- Week three, try a daily huddle with one squad and count how many blocked tasks clear per day.
Plot the outcome weekly on a run chart. If you see a sustained shift or trend, standardize the successful practice and plan the next spread test; if not, adapt and retest.
How to get started in 30 days
Week 1 — Frame it. Pick one stubborn business outcome (DSO, first‑contact resolution, time‑to‑fill, on‑time delivery). Write a one‑sentence aim that states who/what/how much/by when. Establish a baseline with several data points.
Week 2 — Build your theory. Draft a driver diagram with two to four primary drivers and a handful of secondary drivers and ideas. Select one outcome, one to three process measures, and one balancing measure that directly reflect your theory.
Week 3 — Test quickly. Hold a standing 20‑minute weekly review. Run two tiny tests with consenting teams or customers. Capture what happened and what you learned.
Week 4 — See the signal. Maintain a run chart and apply simple rules to avoid reading noise as progress. When you see a signal, standardize locally (SOPs, training, checklists) and design the next test to spread; when you don’t, adjust the idea or the context and run another cycle.
Leadership’s role
Leaders make improvement science possible by protecting time for learning cycles, asking “What did we learn?” instead of “Who’s to blame?”, and removing system barriers surfaced by front‑line tests. Scale by adaptation rather than copy‑paste—expect each region or line of business to tailor the change to its context and re‑measure. Invest in visibility so aims, driver diagrams, PDSA logs, and run charts are easy for everyone to see.
Common pitfalls (and how to avoid them)
Solution‑itis. Jumping to a favorite fix before you have an aim, drivers, and measures. Counter: write the aim first, build the driver diagram, and test multiple ideas against it.
“Pilot forever.” Big pilots that never scale. Counter: many small PDSAs beat one giant pilot—faster feedback and lower risk.
Metric overload. Endless dashboards that don’t inform action. Counter: keep a tight set of outcome, process, and balancing measures linked to your theory of change.
Overreacting to noise. Treating normal fluctuation as success or failure. Counter: use run‑chart rules and basic variation concepts.
Pulling it all together
Improvement science gives leaders a reliable, low‑risk way to turn strategy into measurable, repeatable gains—by aiming clearly, measuring what matters, testing quickly, and learning in public. You don’t have to choose between running the business and improving it. This approach helps you do both.
